Part I: Introduction to R
What is R ?
R is a programming language and open-source software environment that is widely used for statistical computing, data analysis, and graphics. It was created by Ross Ihaka and Robert Gentleman at the University of Auckland, New Zealand, in the early 1990s and is now maintained by the R Development Core Team. R is particularly popular among statisticians, data scientists, and researchers for its extensive statistical and graphical capabilities.
In an brief sentence: R is a dialect of S.
What is S ?
The S language, developed by John Chambers and others at Bell Telephone Laboratories, began in 1976 as an internal statistical analysis tool, originally based on Fortran libraries. It evolved significantly over time: in 1988, it was rewritten in C, leading to a system more akin to its present form (Version 3).
The statistical analysis capabilities of S were detailed in the 1988 book “Statistical Models in S” (the white book) by Chambers and Hastie. The most current version, Version 4, released in 1998 and documented in Chambers’ “Programming with Data” (the green book), remains in use. The ownership of S has changed hands several times: Bell Labs licensed it to StatSci (later Insightful Corp.) in 1993, Insightful then bought it from Lucent in 2004, and after a series of acquisitions, TIBCO Software Inc. has owned and exclusively developed S since 2008. Insightful had added features, including GUIs, and marketed it as S-PLUS. Despite these changes, the core S language has remained largely unchanged since 1998, the year it earned the prestigious ACM Software System Award.
Key features and characteristics of R :
Data Analysis and Statistics:
Rprovides a wide range of statistical techniques and libraries for data analysis, hypothesis testing, regression analysis, clustering, and more. It’s known for its flexibility in handling data and conducting statistical experiments.Data Visualization:
Roffers powerful tools for creating a variety of high-quality data visualizations, including scatterplots, bar charts, histograms, and heatmaps. The ggplot2 package, in particular, is a popular choice for creating customized graphics.Open Source:
Ris open-source software, which means that it is freely available for anyone to use, modify, and distribute. This has led to a vibrant community of users and developers who contribute packages and extensions to enhance its functionality.Package System:
Rhas a rich ecosystem of packages (libraries) that extend its core functionality. These packages cover a wide range of domains, from machine learning and time series analysis to bioinformatics and geospatial data analysis. Users can easily install and use these packages to tailor R to their specific needs.Cross-Platform:
Rruns on various operating systems, including Windows, macOS, and Linux, making it accessible to a wide range of users.Command-Line Interface:
Rprimarily uses a command-line interface, although there are graphical user interfaces (GUIs) available, such as RStudio, which provide a more user-friendly environment for coding and data analysis.Community Support:
Rhas a large and active community of users and developers who provide support, share code and tutorials, and contribute to the ongoing development of the language.
R is a versatile tool used in various fields, including academia, industry, finance, healthcare, and more, for tasks such as statistical analysis, data visualization, and predictive modeling. Its popularity continues to grow as data-driven decision-making becomes increasingly important in many domains.
Installing R and Rstudio
Find the installation guide in the below pdf file.
Alternatively , you can look at these videos .
Basic RStudio layout and functionality
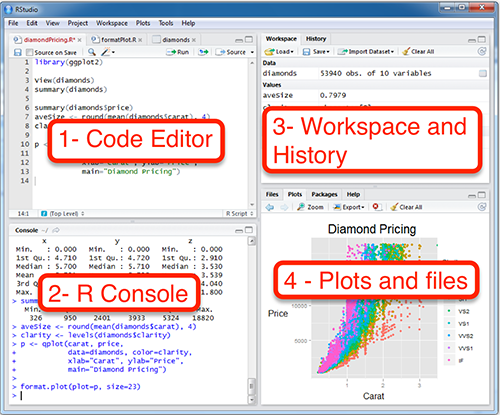
Figure 1: From: http://www.sthda.com/english/wiki/r-basics-quick-and-easy
Code Editor/ R script: Here you can write either R code , or Rmarkdown. That is we can include instructions for our computer to execute.
R console : Here you see the output of the code you run , if you write code here, it will automatically be run after
enterand cannot be traced back, that is why the R Script is useful for reusable code.Workspace and history: This space display the variables created , in use, the history , building , git and more. To check if your data has been loaded correctly you can check here to see it loaded.
Plots and files: It will display the graphs and plots created, you can switch back and forth , export, save and more. Also, you can select packages, get help on
Rfunctions and more.
What are packages?
The power of R lies in the packages. Since R is open source, many people create packages i.e, R scripts that contain functions for specific problems , may it be standard deviation , statistics, machine learning and more.
- To install a package, simply type
install.packages("package name")
Install a package from Bioconductor:
biocLite()Install a package from GitHub:
devtools::install_github()View the list of installed packages:
installed.packages()Folder containing installed packages:
.libPaths()To load a package
library(package name)
- View loaded packages
- to Unload an R package:
detach(package name, unload = TRUE)
- Remove installed packages:
- Update installed packages: