Part I: Functions and Control Structures
Writing and using functions
Example: A simple function to calculate the square of a number
\[ f(x) = x^2 \]
square_function <- function(x) {
  return(x^2)
}

# Using the function
result <- square_function(4)
print(result)
#> [1] 16
Exercise 1
Task: Write and Use a Function Objective: Create a function that calculates the cube of a number and use this function to calculate the cube of 3.
Hint: Use the structure of the square_function as a template.
The reason why this is useful, is because functions are used for anything we want, R functions are just similar to the one we have just created, optimized for the specific tasks they were designed for .
We now create a more complex function , one that takes a vector , finds the mean , standard deviation and the histogram
analyze_vector <- function(x, plot_title = "Histogram") {
  # Check if the input is numeric
  if (!is.numeric(x)) {
    stop("Input must be a numeric vector")
  }

  # Calculate mean and standard deviation
  mean_value <- mean(x)
  std_value <- sd(x)

  # Output the mean and std
  cat("Mean:", mean_value, "\n")
  cat("Standard Deviation:", std_value, "\n")

  # Create a histogram
  hist(x, main = plot_title, xlab = "Values", col = "lightblue", border = "black")

  # Return a list containing the mean and std
  return(list(mean = mean_value, std = std_value))
}

# Example usage with the mtcars$mpg vector
result <- analyze_vector(mtcars$mpg, "MPG Histogram")
#> Mean: 20.09062
#> Standard Deviation: 6.026948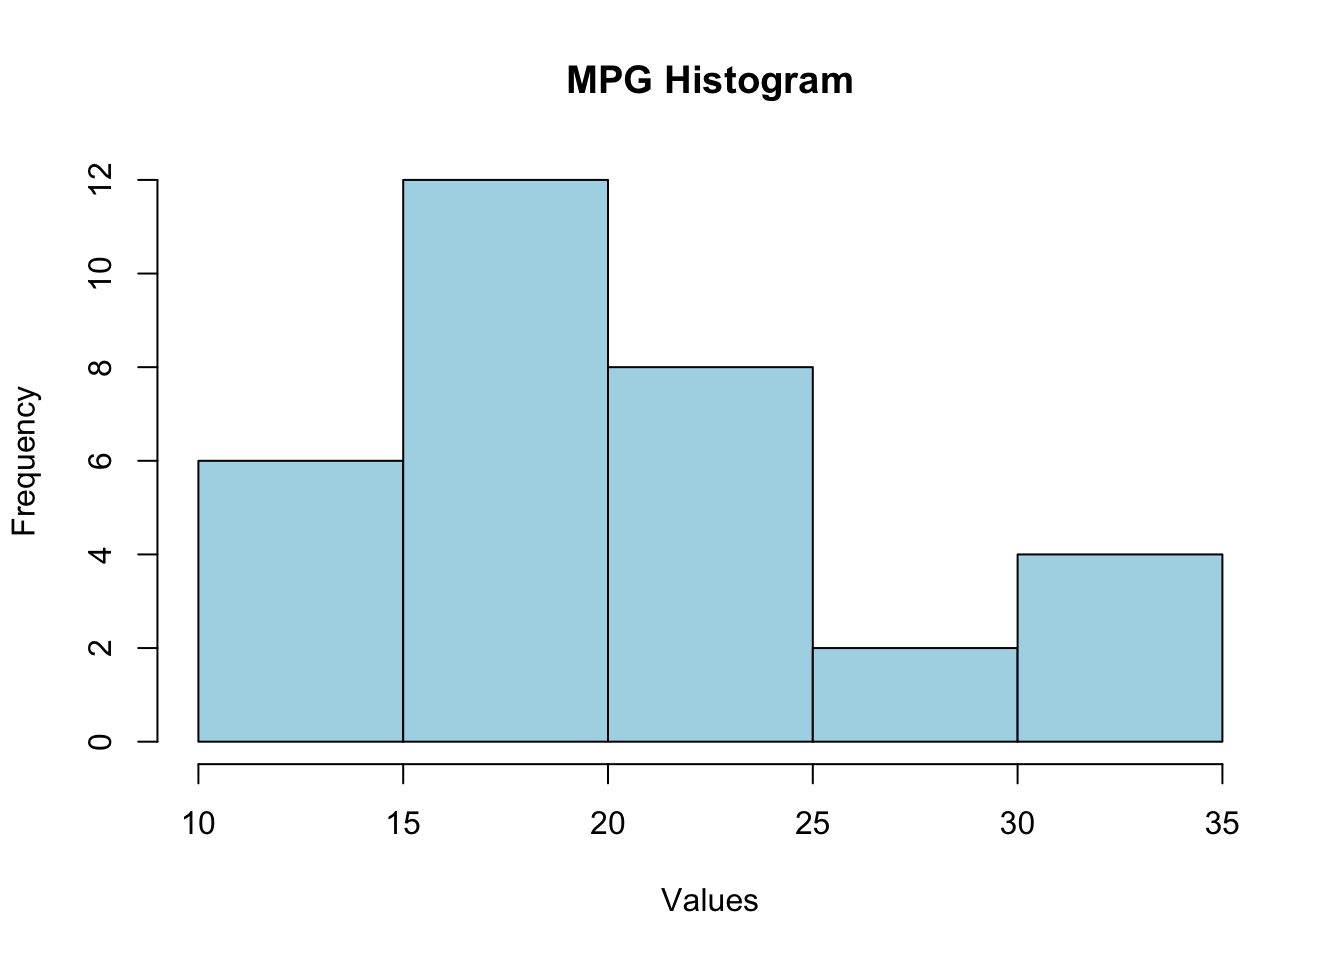
Exercise 2
Task: Analyze a Numeric Vector Objective: Write a function named summarize_vector that takes a numeric vector as input and calculates the median, variance, and creates a boxplot. The function should print the median and variance, and return them as a list. Use the airquality$Ozone data for analysis.
Hint: Similar to analyze_vector, check if the input is numeric and use median, var, and boxplot functions.
If statements and loops (for and while)
Example:
For loop to calculate the factorial of a number